Using the HTML report
The CLI can emit a self-contained HTML report — a single .html file with inline CSS and a minimal inline script for interactivity. No build step, no bundler, no external assets; you can email it, attach it to a ticket, or archive it as a CI artifact and it still works opened via file://.
Generate a report
Section titled “Generate a report”-
Run the CLI with
--htmlTerminal window npx @flaky-tests/core --htmlTerminal window pnpm @flaky-tests/core --htmlTerminal window yarn @flaky-tests/core --htmlTerminal window npx @flaky-tests/core --htmlTerminal window pnpm @flaky-tests/core --htmlTerminal window yarn @flaky-tests/core --htmlThe CLI writes the report to a temp file, prints its path, and opens it in your default browser.
-
Or write to a specific location with
--outTerminal window bunx @flaky-tests/core --html --out flaky-report.htmlUse this when you want to commit the file, attach it to a PR, or upload it as a CI artifact.
Wire it into package.json
Section titled “Wire it into package.json”Drop a dedicated script into package.json so report generation is a
single command everyone on the team can run:
npm i -D @flaky-tests/corepnpm add -D @flaky-tests/coreyarn add -D @flaky-tests/core{ "scripts": { "flaky:report": "flaky-tests --html", "flaky:report:save": "flaky-tests --html --out flaky-report.html" }}CI jobs can then call bun run flaky:report:save (or the npm / pnpm /
yarn equivalent) and upload the resulting flaky-report.html as a
workflow artifact.
What’s in the report
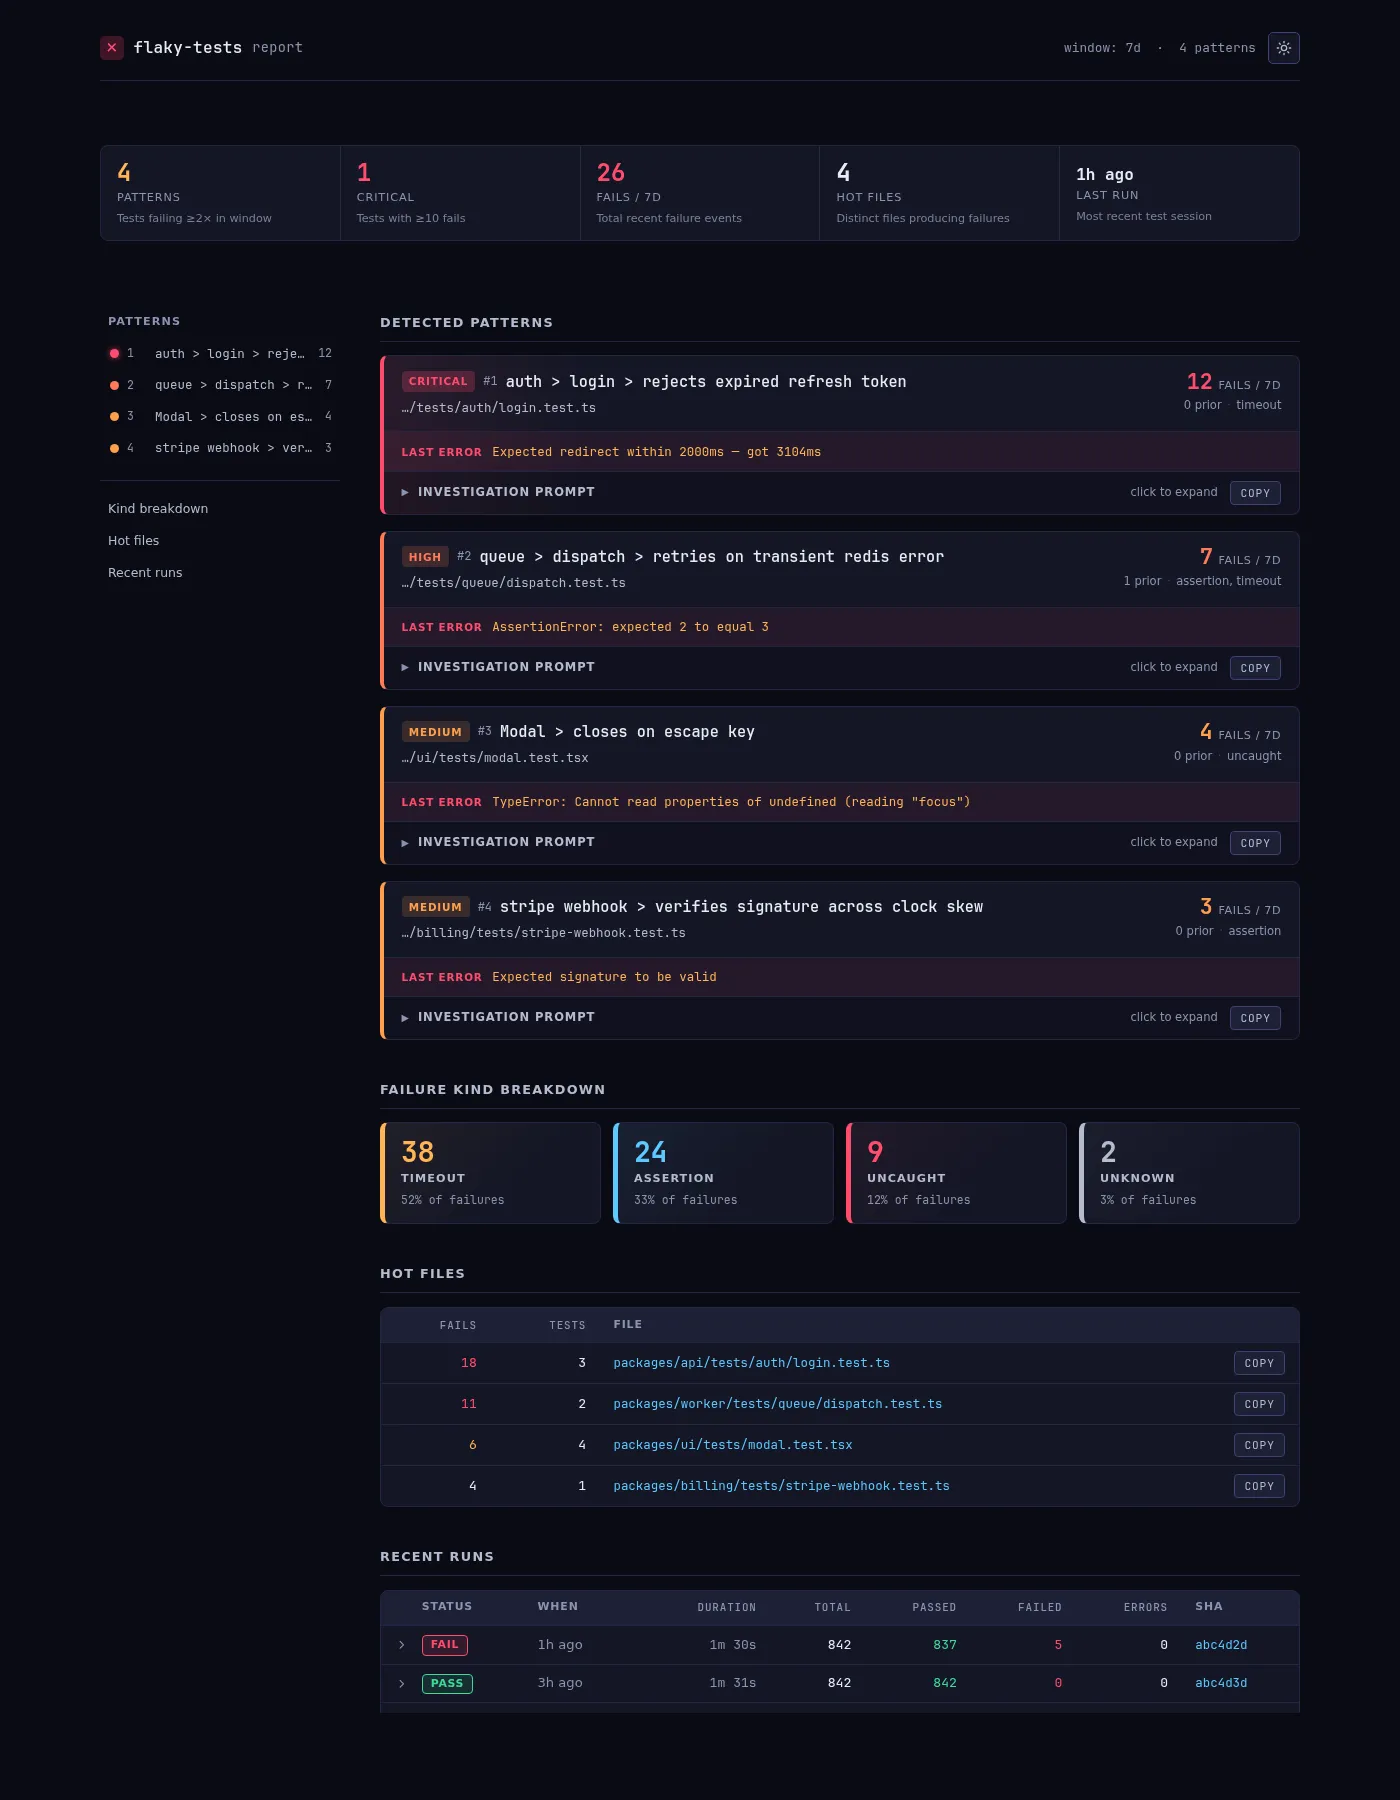
Section titled “What’s in the report”Header stat strip
Section titled “Header stat strip”Five at-a-glance counters across the top:
| Cell | What it means |
|---|---|
| patterns | Tests failing ≥ threshold in the window |
| critical | Tests with ≥ 10 recent fails |
| fails / Nd | Total failure events inside the window |
| hot files | Distinct source files producing failures |
| last run | Relative time since the most recent recorded run |
Sticky table of contents
Section titled “Sticky table of contents”A left-rail navigator with a severity dot per pattern (red / coral / orange / yellow for critical / high / medium / low) and jump links to each dashboard section. Stays pinned as you scroll; collapses to a static list on narrow viewports.
Pattern cards
Section titled “Pattern cards”One card per newly-flaky test, sorted by recent-fail count descending. Each card shows:
- A severity pill and card number
- The test path (
outer > inner > name) and file location - Recent/prior fail counts
- The first line of the most recent error
- A collapsible investigation prompt with a Copy button
The copy button writes the full prompt to the clipboard (via navigator.clipboard when available, falling back to range-selection). Paste into Claude, Cursor, Copilot, or any chat UI to start investigating.
Investigation prompts
Section titled “Investigation prompts”Every pattern card ships with a collapsible investigation prompt —
the same structured prompt the CLI emits under --prompt. It’s the
fastest path from “something’s flaky” to “I have a working hypothesis”.
What’s in each prompt
Each prompt is a single block of plain text assembled from the failure’s context — enough for an LLM to reason about the failure without round-trips:
- The test name and file path
- The failure category (
assertion/timeout/uncaught/unknown) and the first error line - Recent-vs-prior failure counts in the current window
- Trimmed stack frames (stripped of timestamps so diffs are stable)
- The git SHA at capture time — so the investigator can check out the exact state that produced the failure
No PII is added; the prompt is a subset of rows already in your store. See Data model & privacy for exactly what’s captured.
How to use them
- Click the summary row (“Investigation prompt · click to expand”) to see the full text inline.
- Click Copy to put the full prompt on your clipboard. The
button flashes
Copied ✓on success. - Paste into any LLM surface. The prompt is plain text — Claude, Cursor’s inline chat, Copilot Chat, a terminal LLM wrapper, all work the same.
- Fallback path — if clipboard write is blocked (Safari in some iframes, older file:// contexts) the button silently selects the prompt text so you can Cmd / Ctrl+C manually.
Prompt parity with the CLI
The same text is available headlessly:
bun run flaky:prompt # if you added the script# orbunx @flaky-tests/core --promptUseful when you want to pipe prompts into a tool instead of opening the report UI — for example, a bot that posts the first prompt of the day into Slack.
Hot-file prompts
The Hot Files table has its own per-row Copy button. These emit a shorter, file-level prompt (“Investigate <path>: N failures across M distinct tests in the last D days”) — useful when a whole module has gone shaky and individual-test prompts miss the forest for the trees.
Recent runs table
Section titled “Recent runs table”Chronological view of the last 20 recorded runs, filtered to the current project. Columns: status, when, duration, total / passed / failed / errors, short git SHA.
Click or press Enter on any run row to expand its per-failure breakdown — test name, failure kind, error preview, and relative timestamp. The chevron rotates to indicate the expanded state.
Theme toggle
Section titled “Theme toggle”Top-right of the header: a sun / moon toggle. Three modes:
- System default (first visit) — follows
prefers-color-scheme - Light — forced light palette, persisted to
localStorage - Dark — forced dark palette, persisted to
localStorage
The choice survives reloads and follows you across any reports opened from the same origin.
Sharing and archiving
Section titled “Sharing and archiving”Because the report is a single .html file with no external dependencies, it travels well:
- Email / Slack attachment — open directly from the download
- Commit to the repo — diff-friendly for tracking trends over time
- CI artifact — upload once per scheduled detection run
- name: Generate flaky report  run: bunx @flaky-tests/core --html --out flaky-report.html
- name: Upload report uses: actions/upload-artifact@v4 with: name: flaky-report path: flaky-report.html retention-days: 30Interactivity cheatsheet
Section titled “Interactivity cheatsheet”| Action | How |
|---|---|
| Jump to a pattern | Click its entry in the sticky TOC |
| Expand the investigation prompt | Click the Investigation prompt summary |
| Copy a prompt | Click Copy on any card |
| Drill into a run | Click or Enter on a recent-runs row |
| Toggle light / dark | Click the sun / moon icon in the header |
Related
Section titled “Related”- CLI commands — full reference for
--html,--out, and every other flag - Scheduled detection — wire the report into a weekly CI cron
- CI setup — upload the report as a workflow artifact